Industry Report
2019 Industry Report
Published April 14, 2020 - Written by Sebastian Gancarczyk & Jeanene O’Brien
Summary
While 2020 has been marked with uncertainty due to the COVID-19 Virus, the U.S. economy continued its upward trajectory in 2019 marking its longest expansionary period. Find out more about the state of the automotive auction industry in our 2019 Industry Report.
EXECUTIVE SUMMARY
ECONOMY
2019: The U.S. Expansion Continues
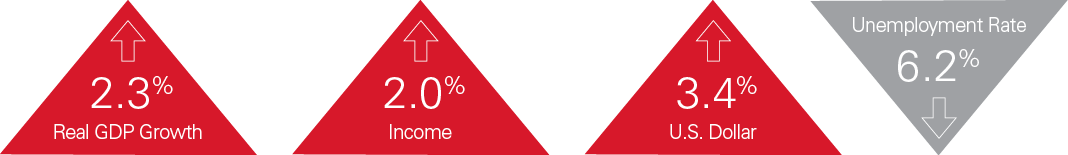
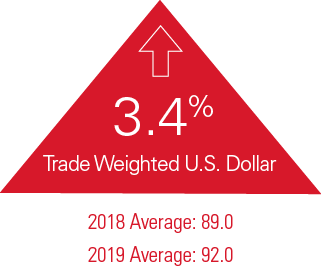
The U.S. economy continued its upward trajectory in 2019 marking its longest expansionary period. It showed a growth rate of 2.3%, marking a slight down tick from the 2.9% increase in real GDP in 2018. The continued growth was complemented by a strong labor market with unemployment averaging about 3.6% in 2019. This corresponds to levels the U.S. has not reached in over 50 years. The tight labor market was a positive for workers as real wages increased by roughly 2% over the course of the year. While the fundamentals of the U.S. economy remained strong, a cloud of uncertainty pertaining to fear of a global slowdown and trade relations persisted. As a consequence, global investors moved towards the U.S. Dollar as it appreciated by 3.4%.
AUTOMOTIVE
Steady Fluctuations in the Automotive Industry
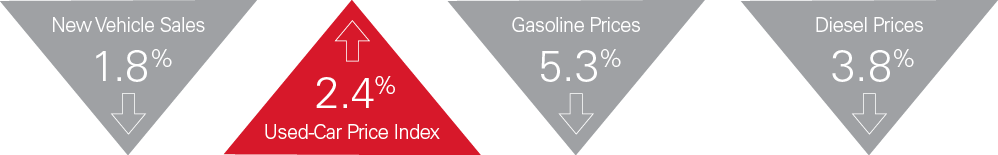
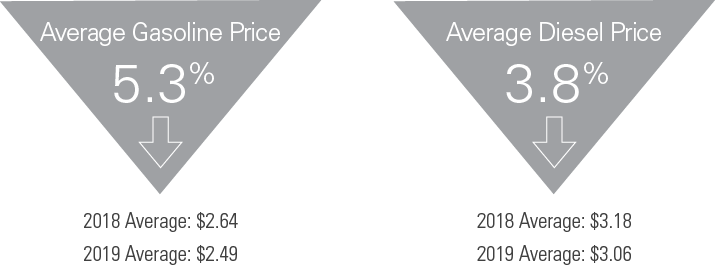
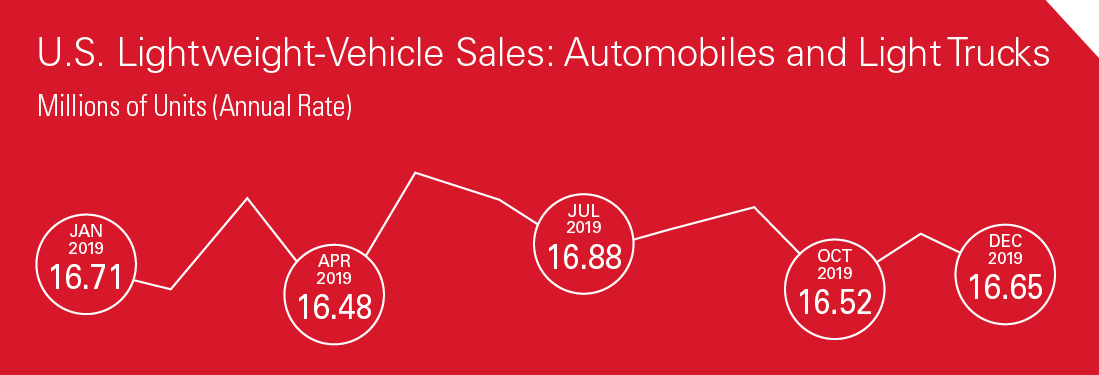
While new vehicle sales fell slightly in 2019 by 1.8%, the state of the industry is strong with new vehicles sales hovering at the 17 million vehicle mark for the year. High prices and trade uncertainty, along with the GM strike helped contribute to the slight weakness in this sector’s performance, with moderate decreases in gasoline prices at the end of the year helping to prop the market up. Gasoline prices ended the year down 5.3% while diesel prices fell similarly by 3.8%.
ECONOMIC INDICATORS
Salvage Industry
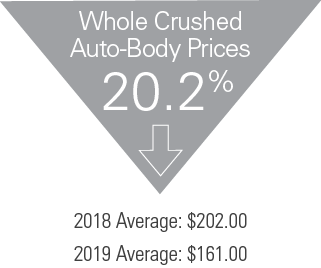
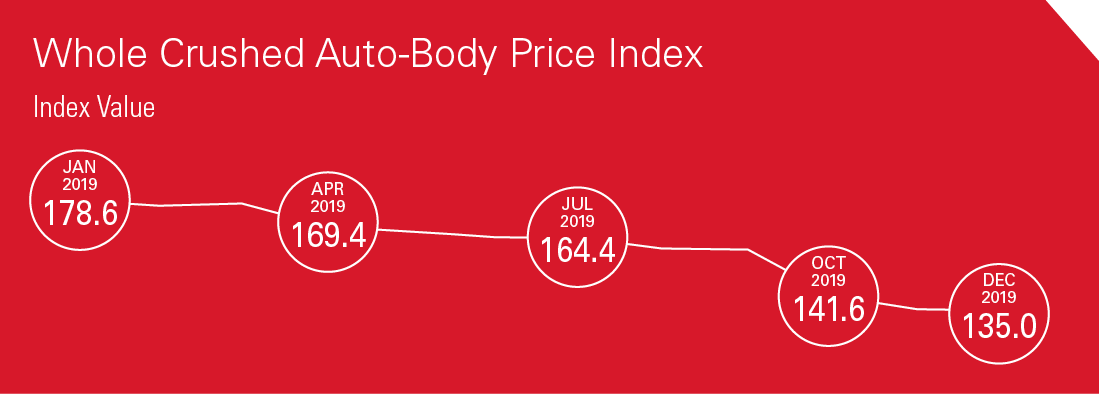
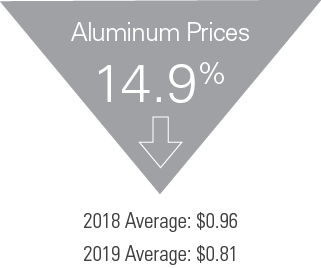
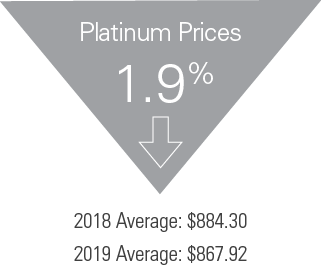
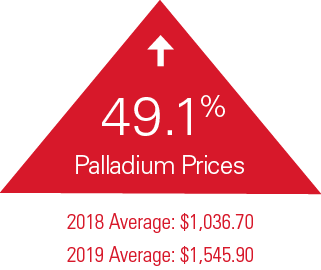
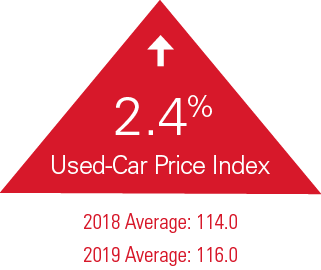
Prices in the used car market experienced a seesaw effect throughout the year with rising prices through the beginning of the year being met with falling prices for the latter. While seasonality helps to explain some of this trend, market fatigue may be contributing to the decreasing prices, but on the whole, prices ended up 2.4% for the year. Whole crushed auto-body prices fell consistently throughout the year, ending with a decrease in 20.2% for the year. The decrease in prices for scrap steel also carried over to the prices of aluminum and platinum which both experienced declines over the course of the year. Trade and regulatory challenges along with a weakening manufacturing sector in the US help to contribute to these trends. Palladium prices, on the other hand, are a different story with prices increasing by 49.1% for the year, partially attributed to a shortage in this precious metal.

U.S. ECONOMY
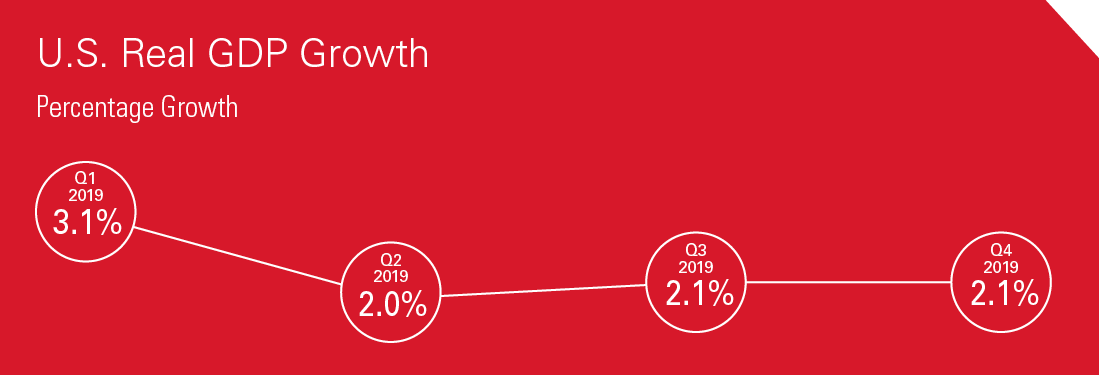
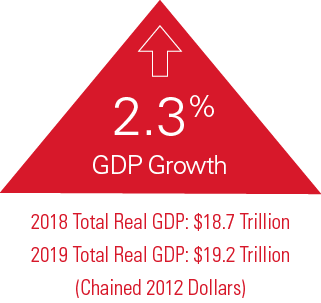
Expansion Continues
The longest expansionary period in U.S. history continued through 2019 as the economy entered its 127th consecutive month of positive economic performance in GDP and unemployment. The year saw real GDP surpass the $19 trillion mark in Q3 with it finishing at $19.2 trillion by the end of Q4, as the expansion is now entering its eleventh year. Despite tumultuous trade relations with China, the U.S. economy grew 2.3% in 2019, down from the previous year’s growth of 2.9%. Uncertainty and fear of a global slowdown likely contributed to a drop in the average growth of private investment from 5% in 2018 to just 1.8% in 2019, despite the Federal Reserve cutting rates for the first time since the financial crisis of 2008-2009.1 However, with an ever-tightening labor market putting upward pressure on wages, consumption spending was able to pick up the slack and accounted for most of GDP’s growth in 2019.2
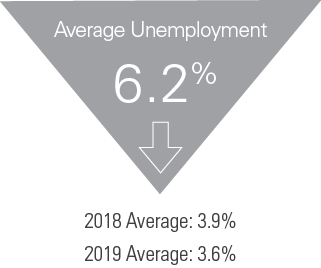
Labor Market Tightens, Unemployment Sits Historically Low
As the expansion continues, unemployment remained at historically low levels in 2019. Average unemployment for 2019 was 3.6%, which is a 6.2% drop from 2018’s average unemployment. Unemployment opened the year at 4.0% and experienced steady declines across Q1, Q2, and Q3 finishing out the year at 3.5%. This means unemployment sat well below the CBO’s estimate of the natural rate of unemployment of 4.4% for Q4 of 2019. Opportunities for employment continued to increase as well with 1.8 million jobs being created in 2019. However, this is down slightly from the 2.1 million jobs added in 2018.3
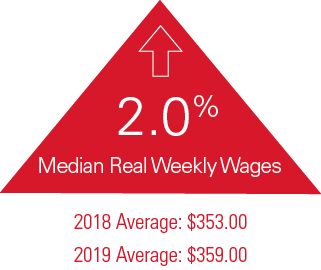
Pay-Day for the U.S. Worker
As the labor market continues to tighten, companies have continued to raise wages to attract new talent and fill vacancies. Median real weekly wages continued to grow through 2019 increasing almost 2.0% for the year and have grown every quarter since Q4 of 2017.4 Average hourly wages for 2019 also grew 3.3% from 2018 and outpaced 2018’s growth of 3.0%.5 The continued strong consumer spending in 2019 is likely due to current increases in wages coupled with expectations that wages will continue to rise as more bargaining power shifts away from employers and into the hands of potential employees.
Dollar Rises with Uncertainty
The dollar appreciated 3.4% in 2019, ending a two-year slide in the value of the dollar. The trade-weighted U.S. Dollar index averaged 92.01, up from 2018’s 89.01. This occurred despite the Fed cutting rates not once, but three times in 2019. These were the first rate cuts since the recession and resulted in a 75 basis point drop in the target Federal Funds Rate over the course of the year. However, as investors confront rising global economic uncertainty surrounding Brexit and U.S.-China trade relations, it appears investors have chosen the dollar as a safe bet.6 Despite rate cuts typically lowering spreads all else equal, interest rates in the U.S. remained high relative to other large economies, which contributed to the greenback’s 2019 appreciation.
Fuel Prices: A Tale of Two Halves
Despite significant increases in gas prices in the first half of 2019, the average gas price in the U.S. was down 5.3% or roughly $0.15 per gallon from 2018. Gas prices opened the year at $2.15 per gallon in January and peaked in May at $2.73. However, Q3 and Q4 saw steady, modest decreases allowing prices to settle at $2.47 by December. The behavior of gas prices was largely due to fluctuations in crude oil prices over the course of the year.7 From January to April, crude oil prices increased $12.48 per barrel, roughly a 24% increase. However, this eventually gave way to falling prices in the latter half of the year. Not surprisingly, diesel prices behaved similarly to gas prices in response to the fluctuations in crude oil. Diesel started January at $2.98 per gallon and rose 4.7% by April, or about $0.14 per gallon, before finishing the year at $3.06. Average diesel prices for 2019 were down 3.8% from the previous year which translates into about $0.12 per gallon.
AUTOMOTIVE INDUSTRY
Total New-Vehicle Sales
While the auto industry is still healthy, backed by a strong economy and low unemployment, new-vehicle sales fell once again in 2019 by -1.8%. This segment of the auto industry saw instability, likely caused by uncertainty in trade deals with China, Mexico, and Canada. Other factors hindering sales growth included high interest rates and record-level prices. December saw a record new-vehicle sale average of $34,602. General Motor’s 40-day strike impacted many aspects of the auto industry, largely contributing to the decline of the manufacturing industry and causing G.M. to lose about $600 million in revenue. This created ripple effects throughout the economy, such as a decrease in employment for jobs related to production and trucking.8 The industry remains strong despite falling new vehicle sales, as units passed the 17 million mark for the fifth year in a row which is now becoming an indicator of a healthy market.9
SEGMENT ANALYSIS
IAA’s framework for analyzing the salvage vehicle market includes five indicators of industry health.
Whole Crushed Auto-Body Prices: Compiled monthly by American Recycler, this measures five regional monthly averages for whole crushed car prices.
Metal Prices: Aluminum (London Metal Exchange spot prices), Platinum (Johnson Matthey base prices) and Palladium (Johnson Matthey base prices).
Vehicle Parts and Equipment Prices: A Bureau of Labor Statistics index that measures the average change over time in consumer prices paid for vehicle parts and equipment.
Used-Car Price Index: Measures the average monthly selling price of used cars and light trucks in the whole-car auction industry; compiled by ADESA.
U.S. Dollar Index: A Federal Reserve Bank of St. Louis index that measures the value of the U.S. dollar against an index of seven major currencies: the euro, Canadian dollar, Japanese yen, British pound, Swiss franc, Australian dollar and Swedish krona.
To more accurately track how these five indicators relate to the market for salvage vehicles, IAA divides its inventory into three segments based on selling price. Each vehicle grade has unique characteristics and reacts to the aforementioned market factors differently.
Low-Grade Vehicles represent the bottom quintile (bottom 20%) and are older, have more miles or are more damaged than the average vehicle sold at auction. These vehicles are primarily purchased for their usable parts or scrap value. Therefore, their value is tied to the price of parts and scrap metals.
Mid-Grade Vehicles represent the middle three quintiles (middle 60%) and compose the largest portion of IAA’s inventory. These vehicles range from those that will be dismantled for parts and scrap to those that will be repaired and driven again.
High-Grade Vehicles represent the top quintile (top 20%) and tend to have little or no damage. This segment also includes high-value vehicles with desirable parts.
ECONOMIC INDICATORS OF AUTOMOTIVE SALVAGE
Whole Crushed Auto-Body Prices
Prices fell significantly throughout 2019 with each consecutive quarter seeing a decline. Average crushed car prices in Q4 fell to $135, the lowest average we have seen since late 2016. Scrap steel is seeing all-time low prices mainly caused by trade and regulatory challenges with China. The demand for scrap is low globally, which more so affects smaller to mid-size companies who cannot afford to hold on to inventories in hope that the market picks up.10
METALS
Aluminum
Trade for aluminum scrap has slowed as an oversupply of the metal drives down prices. Prices saw little fluctuation throughout 2019, seeing an average of $.81/lb. China’s sluggish economic growth contributes to the overall weak demand from consumers. With the Institute for Supply Chain Management’s Purchasing Managers’ Index (PMI) indicating a recession in the manufacturing industry, the likelihood of the industry recovering enough to equalize supply and demand levels proves unlikely.11,12
Platinum
Average platinum prices remained relatively steady, lifted up by spikes toward the end of 2019. Platinum prices suffered from weak demand in China and Europe, but saw a 12% overall increase in total demand. This was offset by a 5% demand decrease in the automotive industry and a 6% decrease in jewelry. The total supply of platinum increased by 2%, and the gap between supply and demand allowed for a slight decrease in prices per pound. Platinum recycling increased by 3% with the help of large pushes upward in the price of palladium and rhodium.13,14
Palladium
Palladium prices hit a record high in December of $2,000.00 per ounce, driven by an increase in demand and a shortage of the precious metal. Another key factor driving up prices was the shutdown of palladium mines caused by a power crisis in South Africa, which is the world’s second-largest supplier. Palladium has seen a surge in demand as the metal is used for catalytic converters in gasoline-powered cars. These converters transform harmful gases into benign nitrogen, carbon dioxide, and water vapor. With more strict emission standards in Europe, China, Japan, and India, demand for the metal has steadily climbed.15
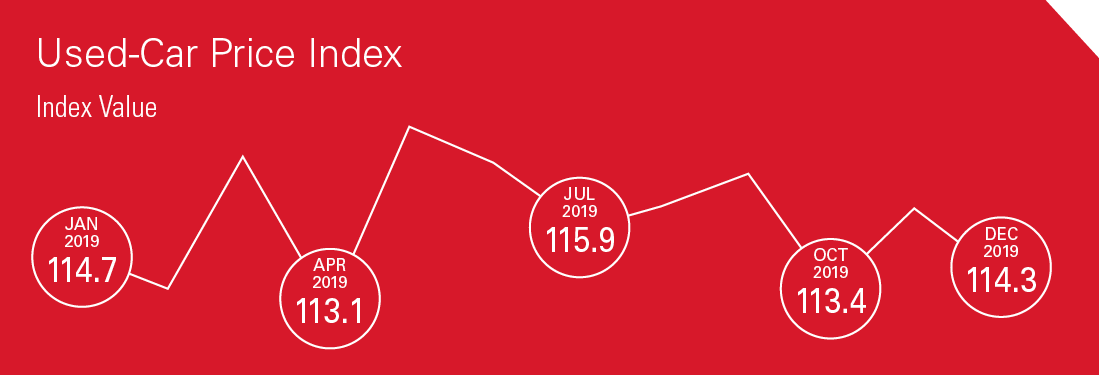
Used-Car Price Index
The used vehicle market remained stable in 2019, seeing month over month growth within the first five months backed by a strong U.S. economy. The growth early in the year resulted from an increase in dealer demand in the used market, a rise in new vehicle prices, and higher levels of clean late-model off-lease units coming into the market at more attractive prices. Toward the end of 2019, used vehicle prices dropped for seven months in a row, which follows seasonal trends, but also may be indicative of market fatigue. Notably, the supply of vehicles in the used market increased throughout the year without deteriorating prices.16
REFERENCES
https://www.wsj.com/articles/the-growth-cost-of-tariffs-11580430490
https://www.wsj.com/articles/dont-credit-the-minimum-wage-for-growing-paychecks-11584314047
https://www.nytimes.com/2019/06/05/business/energy-environment/oil-price.html
https://www.nytimes.com/2019/10/08/business/economy/gm-strike-economy-impact.html
https://www.recyclingtoday.com/article/us-aluminum-scrap-markets-out-of-balance/
https://agmetalminer.com/2019/11/07/aluminum-prices-rising-despite-weak-demand/
https://platinuminvestment.com/supply-and-demand/platinum-quarterly
https://www.nasdaq.com/articles/why-palladium-etf-has-soared-in-2019-2019-12-18